Data
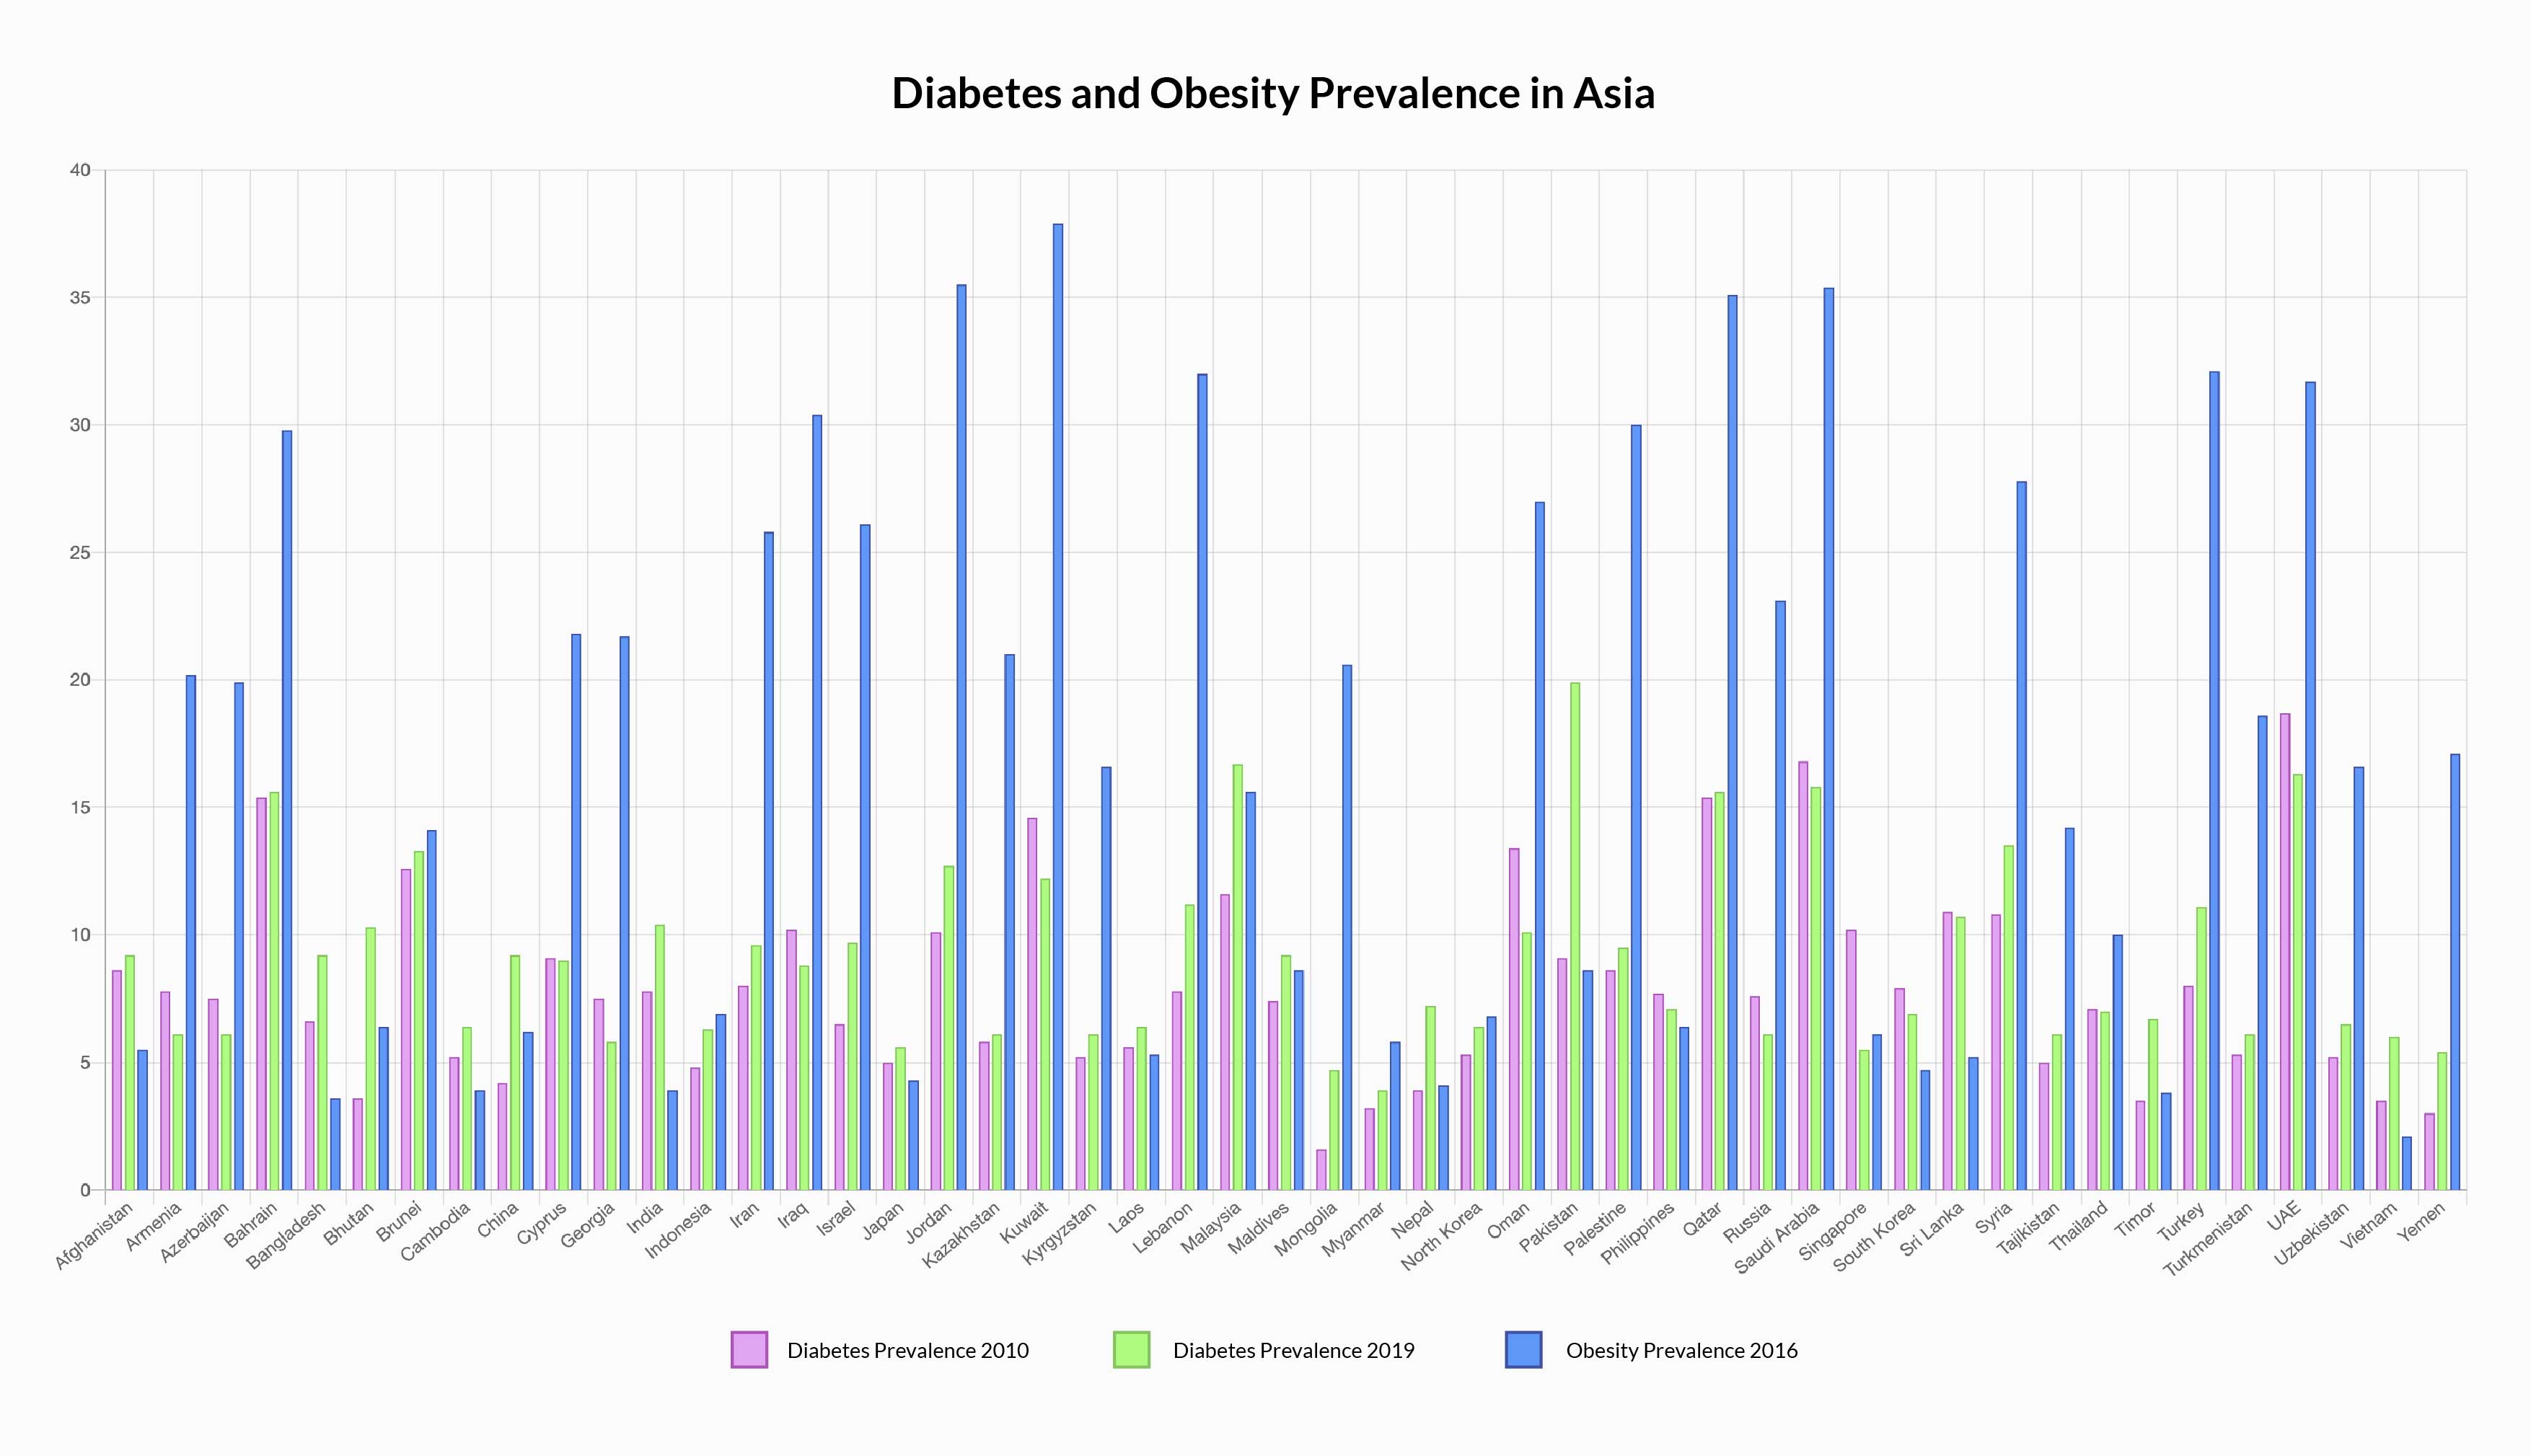
The graphs displayed are to enable a better understanding of the data chosen. The data visualization highlights the correlation between diabetes and obesity. It compares data of diabetes prevalence in 2010 and 2019 and obesity prevalence in 2016 of all 49 countries in Asia.
Introduction
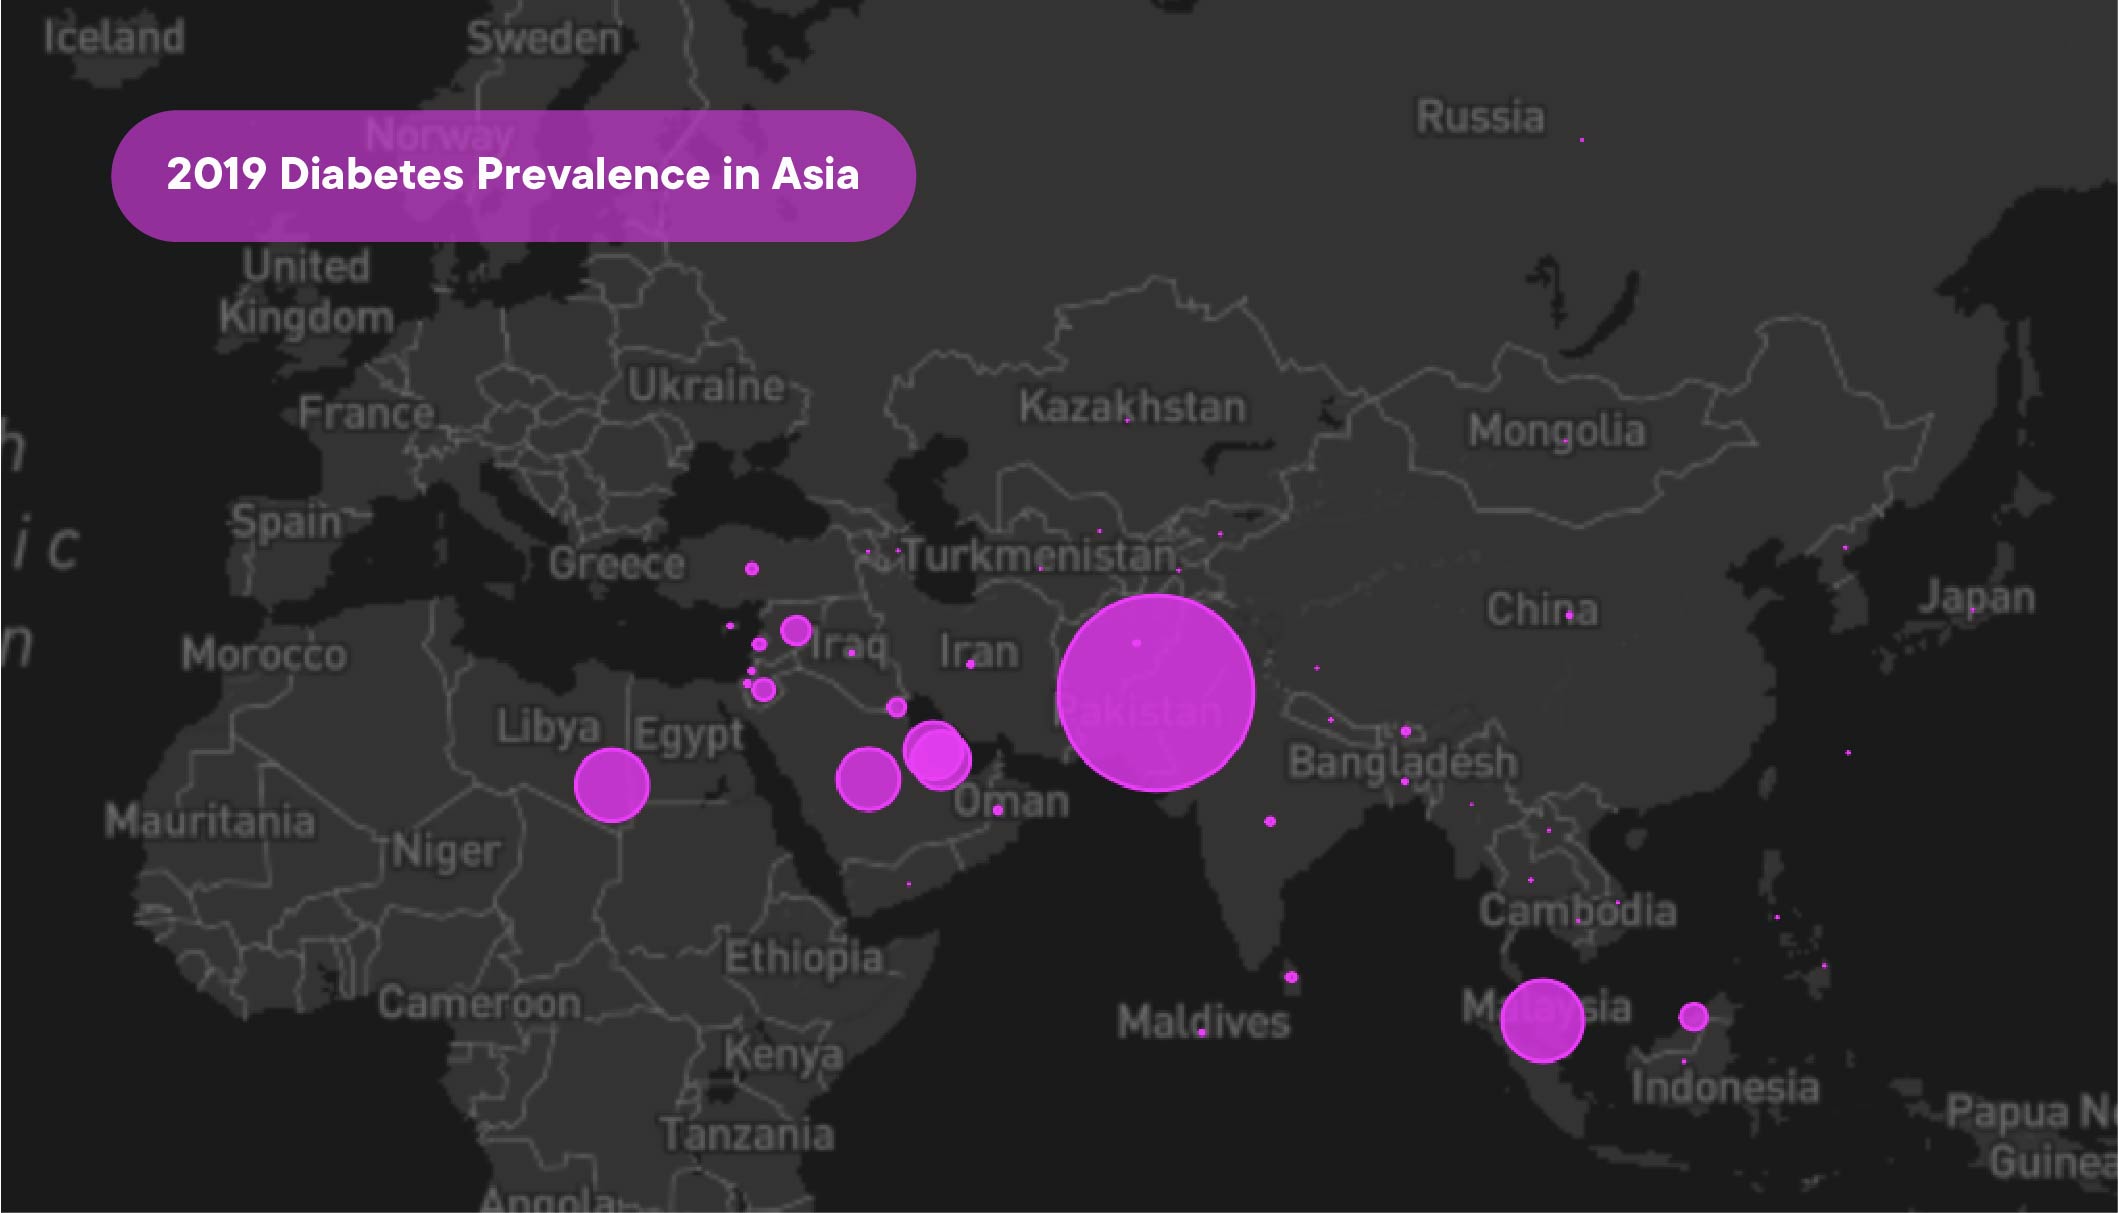
Over the last three decades, we have witnessed an increase in diabetes cases, especially type 2 diabetes. Diabetes is now a primary global and regional concern, and it is a leading cause of death in the majority of countries. In 2013, the International Diabetes Federation (IDF) estimated that 382 million people worldwide had diabetes, with this figure expected to rise to 592 million by 2035. It is stated that more than 60% of the people with diabetes live in Asia, with almost one-half in China and India combined. As I live in Asia, I wanted to showcase the changes in diabetes prevalence from 2010 to 2019 and address which Asian countries successfully minimize diabetic cases.
Data Visualisation
To show changes in diabetes prevalence of Asian countries in two different years (2010 and 2019), as well as its connection with obesity rate, I decided to use a grouped bar chart. The grouped bar chart, like a standard bar chart, is designed to show a distribution of data points or to make comparisons across different categories of data. The grouped bar chart differs in that it divides data points across two categorical variables rather than just one. In which, the chart will allow users to directly compare the data of diabetes prevalence in 2010 and 2019 and obesity prevalence in 2016 side by side.
Findings
The Asia-Pacific region has the highest proportion of overweight and obese people, accounting for approximately 1 billion people, or two out of every five adults. The rising global prevalence of type 2 diabetes coincides with rising obesity rates due to decreased physical activity and increased total calories intake, saturated fat, and sugar-sweetened beverages.
Asian populations are going through a nutritional transition as they adopt more Westernized lifestyles in which caloric intake from animal fat, for example, has nearly doubled in India and China in recent decades. Simultaneously, physical activity has decreased in Asian populations due to rapid urbanization and modernization, increasing type 2 diabetes risk.
Insights
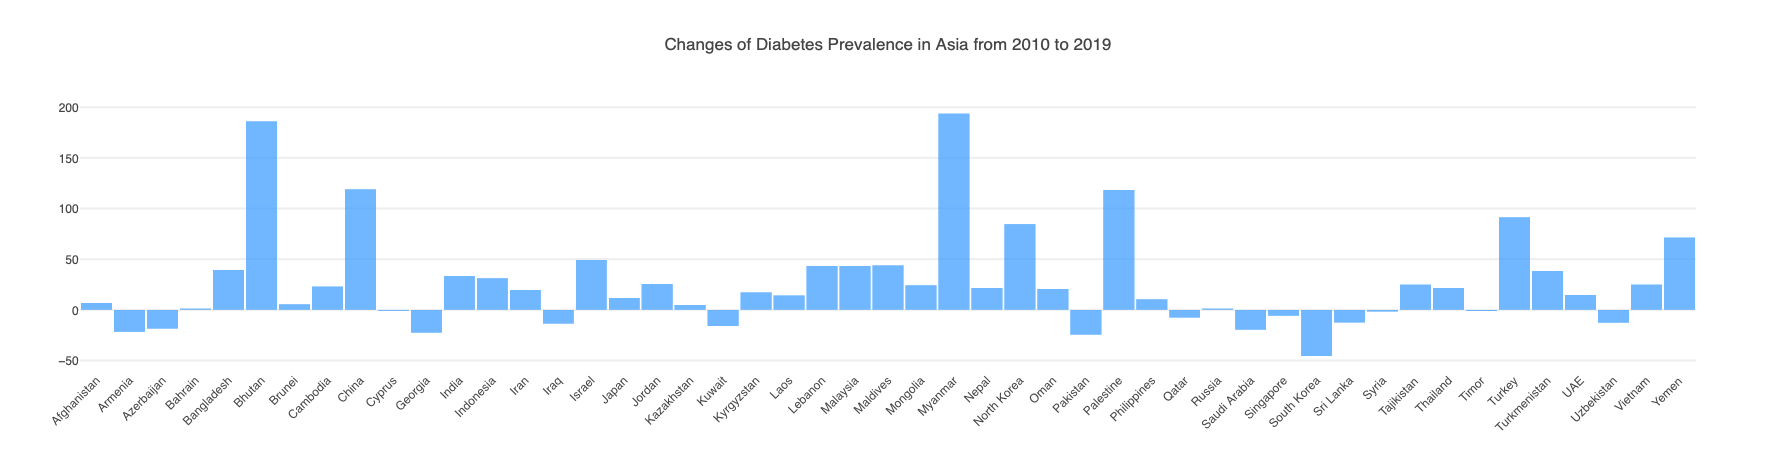
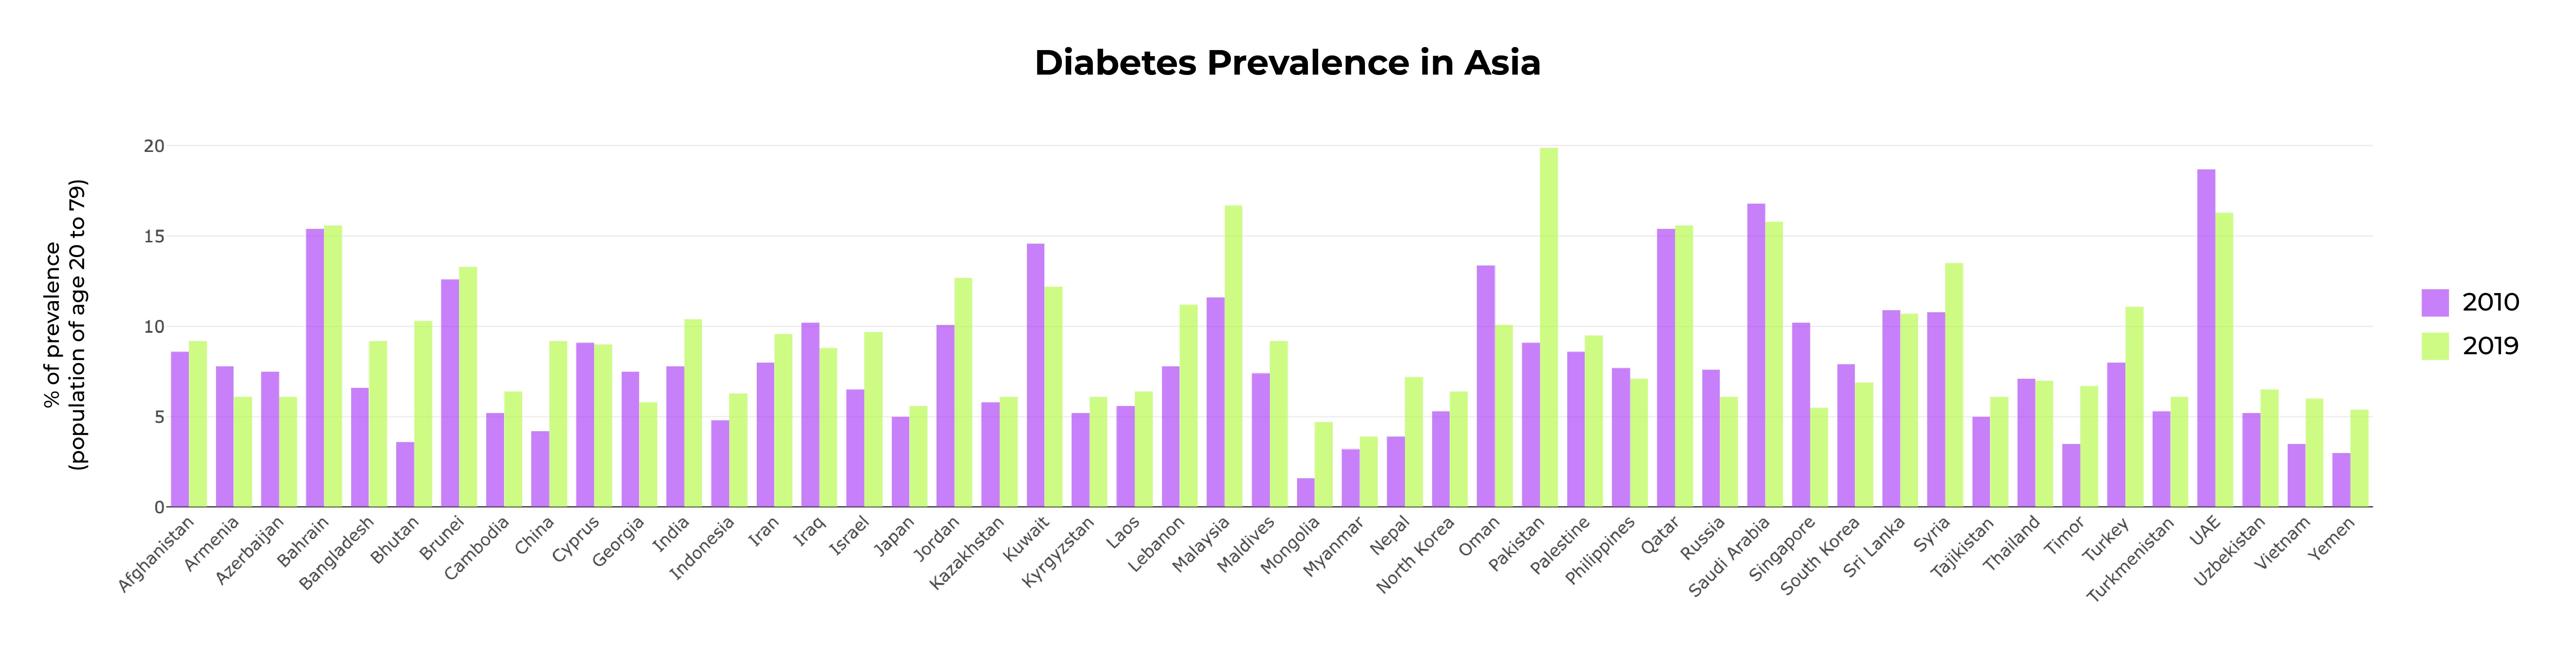
The data addressed a specific age group, adults aged 20 to 79. From the primary data, diabetes prevalence in Asia, Myanmar shows the highest increase in the percentage. At the same time, South Korea showed the highest decrease, which successfully minimized the diabetes rate. From the data, we can also observe that diabetes and obesity correspond with each other. Unfortunately, as the data of obesity prevalence found was not during the same year as the data of diabetes prevalence, we could not draw a firm conclusion.
In addition, not all countries that have a high obesity rate will directly have a high diabetes prevalence, and vice versa as the data being used covers both type 1 and 2 diabetes. For instance, Uzbekistan and Malaysia have almost the same percentage of obesity prevalence, in which Malaysia’s rate is 1% higher. Still, the data showed that Uzbekistan had a 10% lower diabetes prevalence in 2019.
Conclusion
In conclusion, the diabetes prevalence in most countries in Asia continues to increase, especially those in developing countries. Due to rapid urbanization and modernization in Asia, lifestyles are changing and causing the obesity and overweight “time bomb.” Even though obesity rates do not directly influence diabetes prevalence, it is highly associated with type 2 diabetes cases that majorly impact the adult population. By spreading awareness of the continuous increment in diabetes prevalence, I hope Asians can prevent type 2 diabetes by starting a healthy lifestyle.
References
- Abdullah, N., Attia, J., Oldmeadow, C., Scott, R. and Holliday, E., 2014. The Architecture of Risk for Type 2 Diabetes: Understanding Asia in the Context of Global Findings. International Journal of Endocrinology, 2014, pp.1-21.
- Our World in Data. n.d. Diabetes prevalence. [online] Available at: https://ourworldindata.org/grapher/diabetes-prevalence?region=Asia.
- Ritchie, H. and Roser, M., n.d. Obesity. [online] Our World in Data. Available at: https://ourworldindata.org/obesity.